2009-2011 Data provided by Bob Leben
Images

Images
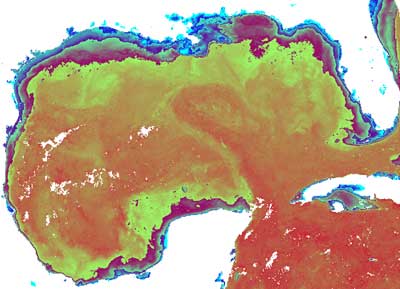
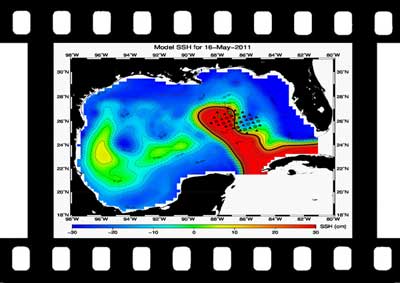
All of the images including SSH data use the CCAR derived product. These images were used to create the various quicktime movies.
Overlays/
- Contains images of SSH contours overlaid on the GOES SST, MODIS color and MODIS SST data sets.
Single/
- Contains images of the GOES SST, MODIS color, MODIS sst and CCAR SSH individually.
Tiles/
- Contains four panel images with the CCAR SSH (top left), GOES SST (top right), 7day average MODIS color (bottom left) and 7-day average MODIS SST (bottom right). The SSH is overlaid on each of the data sets.
NetCDF

NetCDF
All of the data sets are subsetted to the Gulf of Mexico (98W to 80W, 18N to 31N). The data spans Jan 1, 2009 through Dec 31, 2011, with the exception of the model SSH data from Leo Oey.
GOES/
- Contains the daily GOES 24hr, 6km resolution, near realtime SST data.
MODIS/
- Contains the MODIS Aqua Level-2 color and SST data. All of this data is binned to 4km resolution. The data is provided as daily files (1day) and 7-day moving average files (7day). The 7-day moving average is centered about the date of interest (i.e. 1/10/2010 includes 1/7/2010 through 1/13/2010).
ssh/
- Contains the CCAR derived, 0.25 deg resolution, historical SSH. The original data was obtained from the Radar Altimeter Database System (RADS).
Deep-C was a four-year, interdisciplinary study of deep sea to coast connectivity in the northeastern Gulf of Mexico.Deep-C is no longer an active research project. The information on this website is for historical reference purposes only.
Home | About Us | Research Areas | Data Center | News & Multimedia | Education & Outreach
© Deep-C Consortium. All Rights Reserved.
This research was made possible by a grant fromThe Gulf of Mexico Research Initiative (GoMRI).
Copyright | Disclaimer | Privacy Policy

